Meta Ads Dashboard: How to Analyse Campaign Data
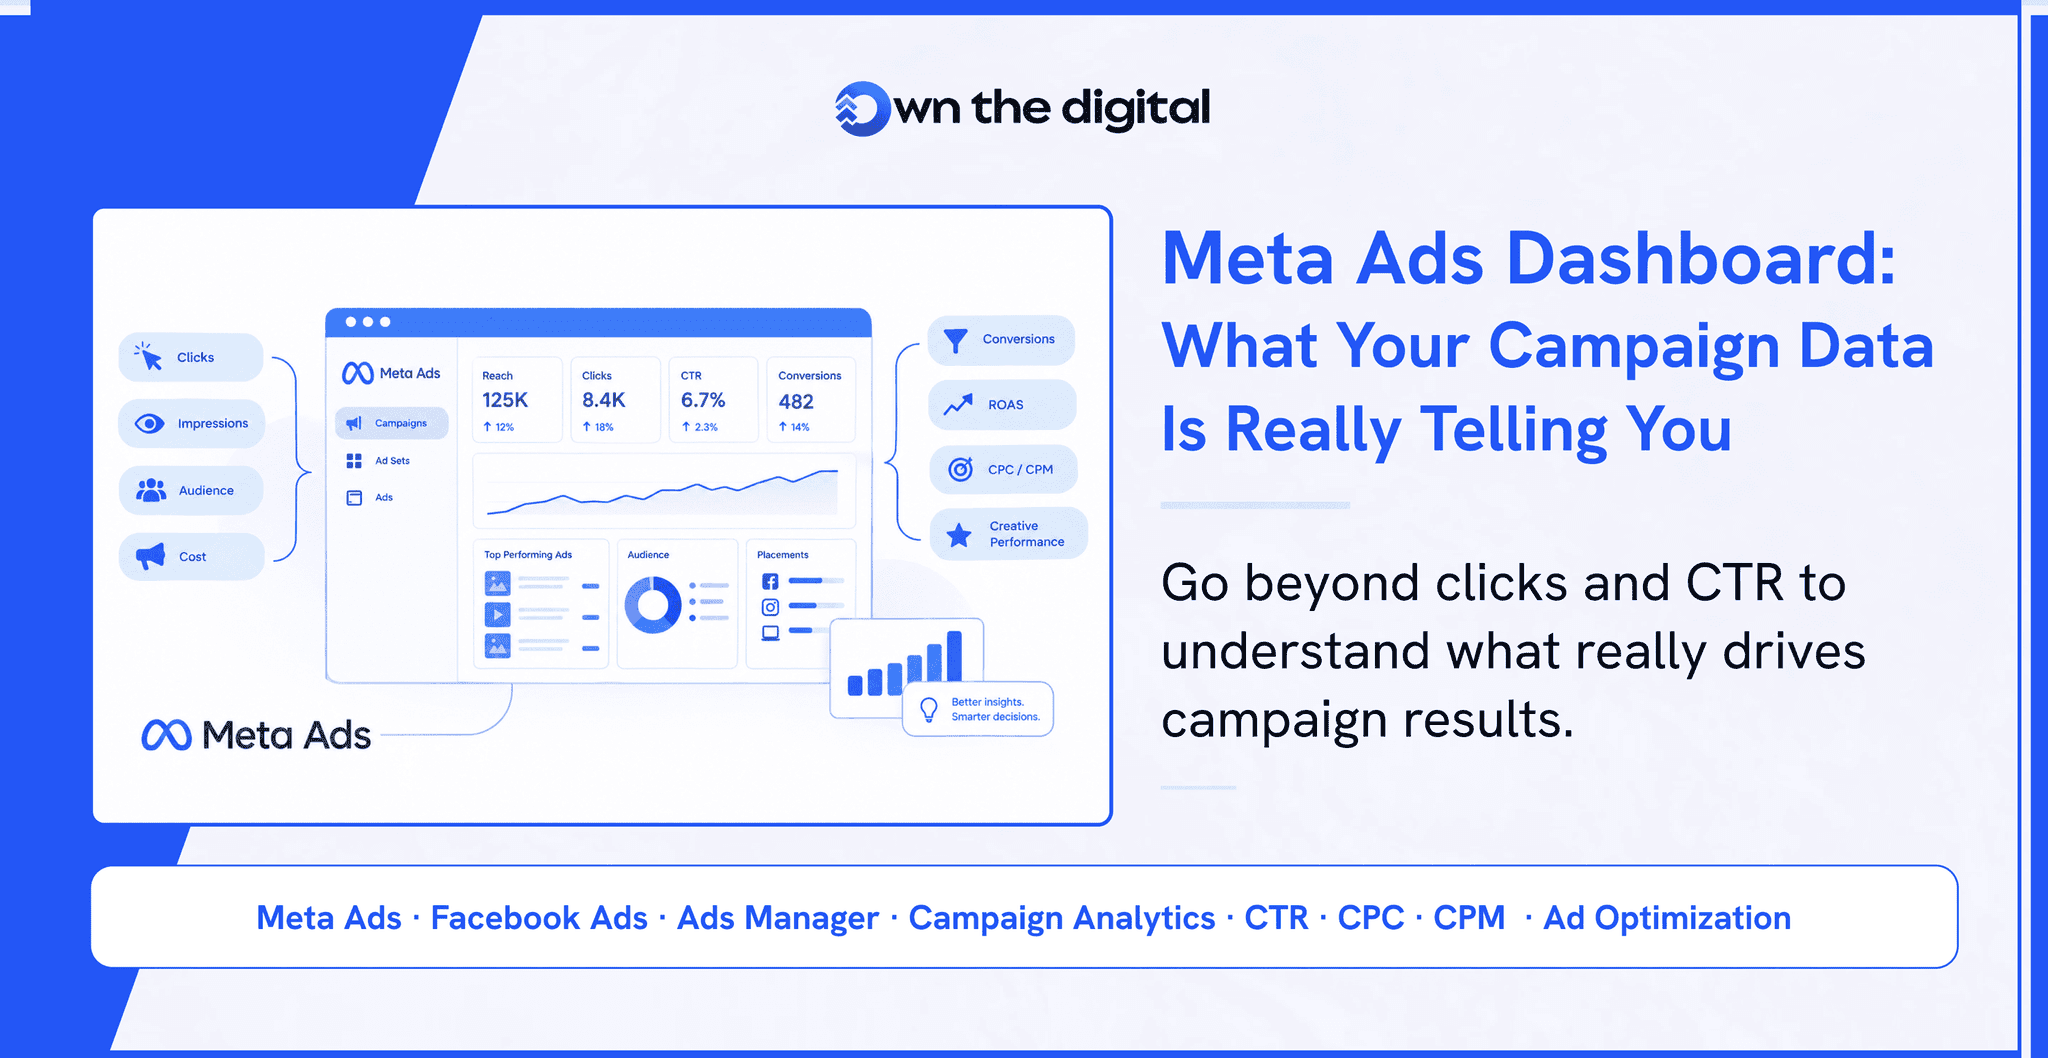
Understand what your Meta Ads campaign data reveals about clicks, conversions, lead quality and business performance.
A digital marketing analytics visual representing the Meta Ads dashboard, with campaign metrics such as impressions, reach, click-through rate, cost per click, conversions and cost per lead. The image illustrates how advertisers can use campaign data to evaluate performance and make informed marketing decisions.
Learn how to read your Meta Ads dashboard beyond clicks and impressions. Discover how CTR, CPC, CPM, conversion rates and lead quality reveal campaign performance and help you make smarter advertising decisions.
Meta Ads can generate a huge amount of information from a relatively small campaign. Open Ads Manager and you will find numbers for impressions, reach, clicks, click-through rate (CTR), cost per click (CPC), cost per thousand impressions (CPM), conversions and cost per lead (CPL). You can also analyse audiences, placements, locations, devices and creatives. On the surface, this looks like everything a marketer needs to understand campaign performance.
The difficult part is deciding what deserves attention.
A Meta Ads dashboard can show that one campaign received more clicks than another, that your cost per lead increased last week or that one creative has a better click-through rate. However, these numbers do not automatically explain whether your advertising is producing something valuable for the business. To understand that, you need to look at the numbers in context.
For marketers, the real challenge is not accessing data. It is separating useful signals from numbers that simply look good in a report.
What Does the Meta Ads Dashboard Show?
The Meta Ads dashboard is where advertisers monitor and analyse campaigns running across Meta's advertising ecosystem. Depending on the campaign setup, it can show information about delivery, audience response, website activity, leads, purchases and other conversion actions.
Campaign data is generally organised around three levels: campaigns, ad sets and ads.
- Campaign level: Provides a broader view of how the overall advertising objective is performing.
- Ad set level: Helps you understand variables such as audience, budget and placements.
- Ad level: Lets you compare the actual creative, copy and format shown to people.
This structure matters because a campaign can look healthy at the top level while hiding problems underneath.
For example, a campaign may be producing leads at an acceptable cost. When you look deeper, you might discover that one ad generates most of the useful leads while another spends a similar amount without delivering meaningful results. Looking beyond the campaign-level numbers helps you identify these differences.
Not Every Metric Deserves Equal Attention
One of the biggest mistakes when analysing Meta Ads is treating every metric as equally important. They are not.
Reach tells you how many people saw your advertisement. Impressions show how many times it was displayed. Frequency provides an indication of repeated exposure, while CPM shows the cost of generating impressions.
These metrics help you understand campaign delivery, but they do not necessarily tell you whether your advertising is commercially successful.
The importance of a metric depends on what the campaign is supposed to accomplish.
- Brand awareness: Reach, impressions and frequency may deserve more attention.
- Website traffic: Clicks, CTR and landing-page activity become more relevant.
- Lead generation: Cost per lead, lead quality and qualified enquiries matter.
- Ecommerce: Purchases, revenue, return on ad spend and customer acquisition costs are closer to the actual business result.
The mistake is not looking at metrics such as CPM or CTR. The mistake is allowing them to become the final measure of success when they are only one part of the picture.
CTR Can Look Great and Still Mean Very Little
Click-through rate (CTR) is one of those numbers that can make a campaign look impressive very quickly. A high CTR suggests that people are responding to your advertisement. This can indicate that your creative or message has caught their attention.
But what happens after the click?
If thousands of people click an advertisement and very few take the intended action, the campaign has not necessarily performed well. The landing page may be unclear, the offer may not match the advertisement's promise, or the audience may have clicked out of curiosity rather than genuine interest.
Consider an ad that generates 1,000 clicks but only five qualified enquiries. Another generates 400 clicks and produces 20 qualified enquiries.
If you judge them only by traffic, the first campaign wins. If you judge them by business value, the second deserves a closer look.
This is why CTR should help you understand the response to an ad, not serve as proof that the advertising worked.
CPC Tells You the Cost of a Click, Not Its Value
The same principle applies to cost per click (CPC). A lower CPC can be useful, especially when you are trying to generate traffic efficiently. However, a cheap click has no inherent business value.
Imagine one campaign generates clicks at ₹8 while another generates them at ₹20. The first appears more efficient. Now imagine that the ₹8 clicks rarely convert, while the ₹20 clicks regularly turn into customers.
The cheaper campaign is no longer obviously better.
This distinction is particularly important for businesses where the customer journey continues beyond Meta. A person may submit a lead form today and become a customer weeks later. If your marketing team only looks at the cost of generating that initial lead, it may optimise for volume rather than valuable prospects.
CPM Needs Context Too
Cost per thousand impressions (CPM) is often used as a quick indicator of advertising cost, but it should not be interpreted without considering what the campaign is achieving.
A higher CPM does not automatically mean that Meta is wasting your budget. Advertising costs can change because of audience competition, campaign objectives, placements, creative performance and the market you are targeting. Reaching a highly valuable audience may naturally cost more.
The more useful question is what you received for that spend.
If a campaign has a higher CPM but produces customers at an acceptable acquisition cost, the CPM itself may not be a problem. If CPM rises while engagement, conversions and downstream results deteriorate, the combination deserves investigation.
One number rarely tells the complete story.
Follow the Journey From Impression to Customer
A useful way to read your Meta Ads dashboard is to stop viewing each metric as an individual result. Instead, follow the journey from the first impression to the final business outcome.
Impression → Click → Landing Page → Conversion → Qualified Lead → Customer → Revenue
Every stage can reveal a different problem.
- Impressions without clicks: Your creative or messaging may need attention.
- Clicks without landing-page visits: There could be a technical issue or a page-speed problem.
- Visitors without conversions: The offer, page experience, trust signals or message consistency may need improvement.
- Leads without customers: Sales follow-up, lead qualification, pricing, product fit or the sales process could be affecting results.
This is why analysing Meta Ads properly often requires looking beyond Meta Ads Manager. Website analytics, customer relationship management (CRM) data and sales outcomes can help explain what happens after a person interacts with your advertisement.
Use Campaign Breakdowns to Find Patterns
The headline campaign number is only the beginning. Meta allows advertisers to break performance down across different dimensions. Comparing these differences can reveal patterns that disappear inside the overall campaign result.
One placement might generate a large amount of inexpensive traffic, while another produces fewer but more valuable conversions. A particular audience group might respond more strongly to one creative. One location could consume budget without contributing enough results.
These patterns can help determine where future budgets and testing should be focused.
However, there is also a risk in breaking data down too much. When marketers keep dividing reports into smaller segments, it becomes easy to find isolated numbers that look impressive but do not represent a meaningful trend.
A small audience with a very low cost per result does not automatically deserve a larger budget. Breakdowns should help answer a specific question rather than become a search for the most attractive number in the dashboard.
Creative Performance Should Be Read Alongside Campaign Data
The dashboard can tell you which ad performed better, but it cannot fully explain what made the difference. That requires looking at the actual creative.
Perhaps one video communicates the offer within its first few seconds while another takes too long to get to the point. One headline might address a specific problem, while another speaks too broadly. One visual may immediately make sense to the audience, while another requires too much interpretation.
These differences can influence campaign performance.
Creative testing should not simply mean producing several advertisements and choosing whichever has the lowest CPC. The objective should be to understand which ideas, messages, formats and offers produce stronger responses from the intended audience.
The dashboard provides the evidence. Comparing the creative provides the context.
Cheap Leads Can Become an Expensive Problem
Lead generation is where dashboard interpretation can become particularly misleading.
Suppose Campaign A produces leads at ₹300 each and Campaign B produces them at ₹600 each. It would be tempting to move more budget towards Campaign A.
But after checking the sales data, you discover that most Campaign A leads are irrelevant, while Campaign B produces prospects who actually fit your business.
The ₹300 lead is not necessarily cheaper in business terms if it requires significantly more effort to turn into revenue.
This is why businesses should ideally connect advertising data with lead quality. A dashboard that reports only lead volume and cost per lead (CPL) can encourage the wrong optimisation decisions.
For lead-generation campaigns, the conversation should eventually move beyond these questions:
- How many leads did we get?
- How many of those leads were worth pursuing?
- How many became customers?
- How much revenue did those customers generate?
Build Reporting Around Business Questions
A useful reporting dashboard should make decision-making easier. Instead of adding every available column to a report, decide what you actually need to know.
- Are we spending more without getting more customers?
- Which campaign is producing the strongest results?
- Which creative is attracting the right audience?
- Are leads becoming qualified opportunities?
- Is the cost of acquiring a customer sustainable?
- Which campaigns deserve more testing, and which need to be reconsidered?
Once these questions are clear, selecting the relevant metrics becomes much easier.
This also prevents reporting from turning into a collection of screenshots and percentages that look detailed but do not lead to action.
Meta Ads Data Should Lead to a Decision
The biggest value of the Meta Ads dashboard is not the amount of information it provides. It is the decisions that information can support.
- A change in CTR might tell you to investigate the creative.
- A rising CPC might prompt you to examine audience competition or ad relevance.
- A falling conversion rate might send you to the landing page.
- A sudden increase in CPL might require you to examine campaign delivery and lead quality.
- A strong campaign might justify further testing before you increase spend.
The number itself is only the starting point. The important part is understanding what changed, why it might have changed and what should happen next.
The Dashboard Is Not the Business
It is easy to get caught up in improving the numbers visible inside Meta Ads Manager: lower CPM, higher CTR, lower CPC, more leads and better engagement.
All of these can be useful improvements. None automatically guarantees business growth.
A company does not run Meta Ads simply to collect clicks. It advertises to create business value, whether that means awareness among a relevant audience, qualified enquiries, purchases, bookings or revenue.
That is why useful Meta Ads analysis connects platform data with what happens after the platform.
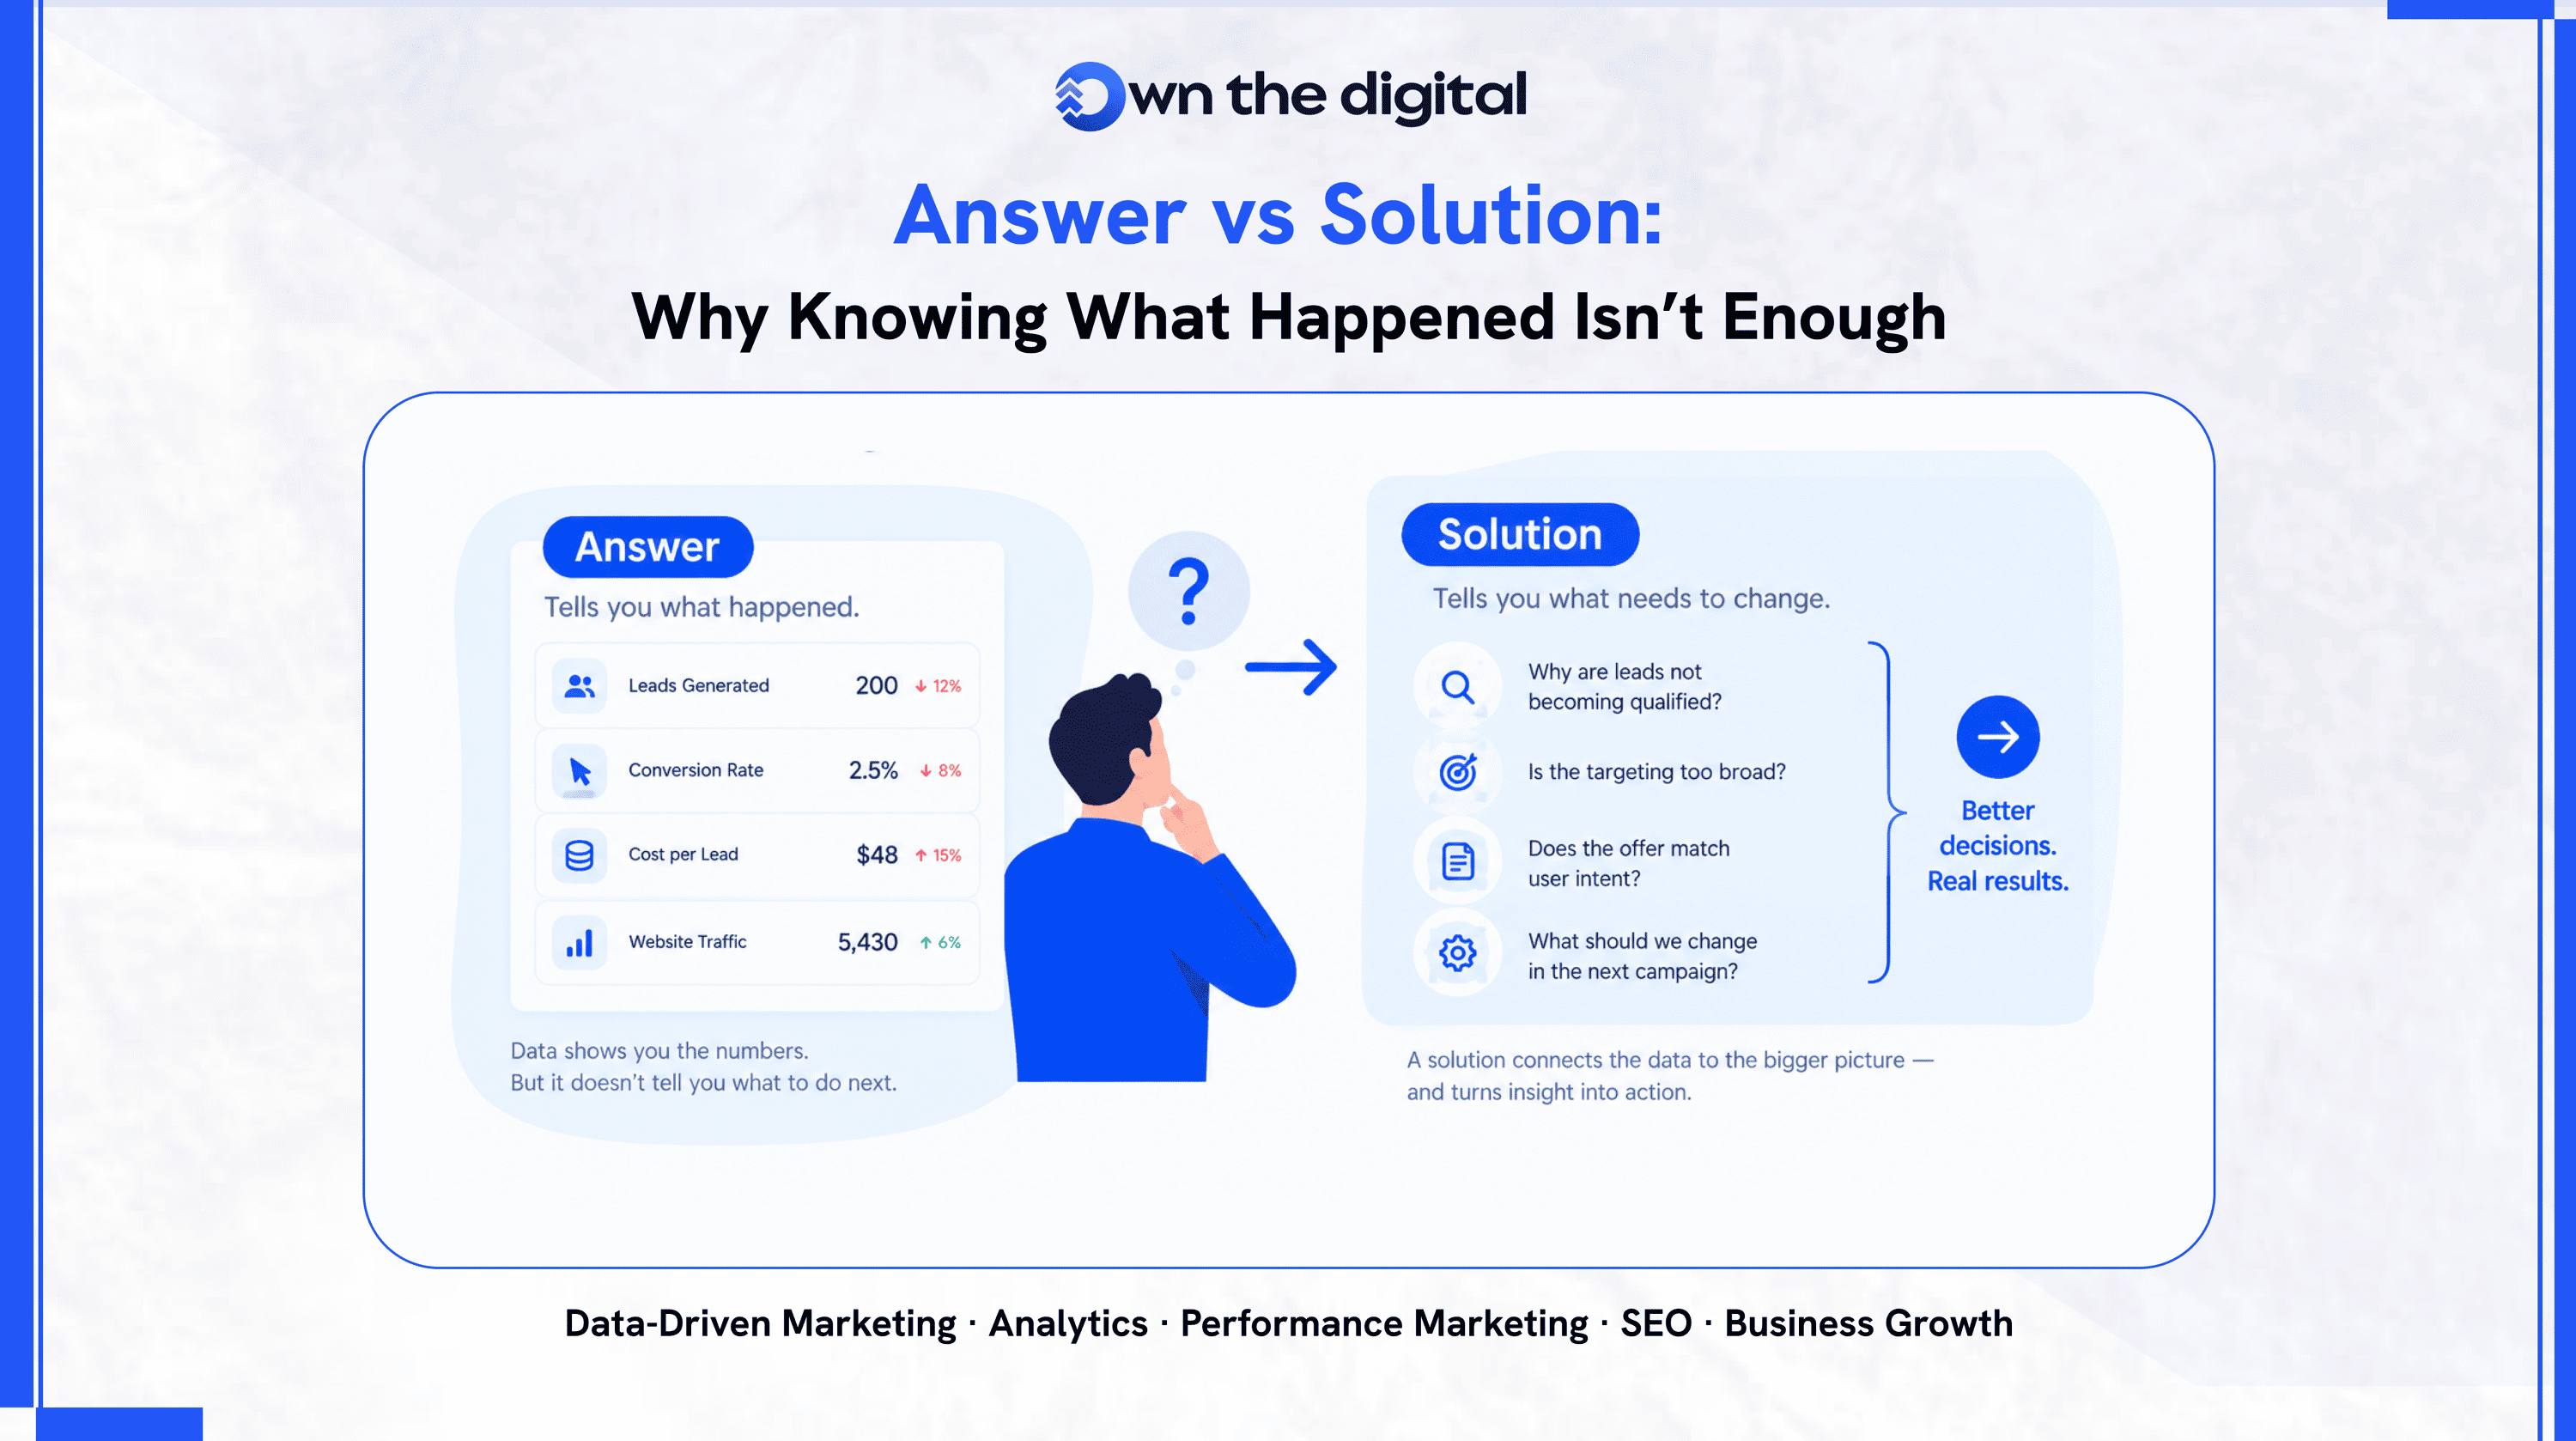
If your dashboard says you generated 200 leads, the next question should be what happened to those leads. If it says you generated 50 purchases, you may need to examine how profitable those purchases were. If traffic increased but sales did not, the increase in traffic alone is not enough to declare the campaign successful.
The dashboard shows the activity. The business outcome determines the value of that activity.
Final Takeaway
Meta Ads Manager gives marketers the ability to see an enormous amount of campaign data. The challenge is knowing which numbers deserve attention and how they relate to one another.
Do not evaluate a campaign through a single metric. Look at how impressions turn into clicks, how clicks turn into actions and how those actions eventually contribute to the business. Compare campaigns, audiences and creatives, but always bring the analysis back to the objective behind the campaign.
A low CPC can be useful. A high CTR can be encouraging. A low CPL can look impressive. But none of them should be the destination.
The better question is whether the money going into Meta is producing something the business actually values.
That is the perspective that turns a Meta Ads dashboard from a reporting screen into a decision-making tool.
Ready to Make Your Meta Ads Work Smarter?
At OTD, we believe successful advertising is about more than clicks and impressions. It’s about turning campaign data into meaningful business results. From improving ad performance to generating quality leads and driving conversions, our focus is on helping businesses make smarter digital marketing decisions.
Want to get more value from your Meta Ads campaigns?Connect with OTD and explore how a data-driven digital marketing strategy can help your business grow.
Get in touch with OTD today to take your digital advertising to the next level.